 _________The Pattern Trapper _________The Pattern Trapper
___________ High Probability Futures Trading |
_Web Site: www.PatternTrapper.com_________E-Mail: Support@PatternTrapper.com_________Phone: 952-892-5550
____ Subscribe________ Trading Course________ Indicator Packages________ Home Subscribe________ Trading Course________ Indicator Packages________ Home
_______The Pattern Trapper FREE! Weekly_______
Report for Thursday, February 26, 2004
|
The Pattern Trapper FREE! Weekly Report identifies important conditions and significant price levels for
trading the S&P;, Dow Jones, Nasdaq, and T-Bond futures markets (both pit and electronic contracts) on
Thursday of each week and is released on other days when market conditions warrant. It is delivered via
e-mail on the evening before the targeted trading day. To register to receive this free report Click Here!
The FREE! Weekly Report is an abbreviated version of daily Pattern Trapper Futures Trading Newsletter.
To see a sample issue of the full newsletter Click Here! To register for a two week free trial Click Here!
To learn how you can incorporate Pattern Trapper methods into your own trading routine Click Here! |
March S&P; 500 (SPH4/ESH4)_Most Recent Trading Day With Pivot System ______Historical Volatility & Narrow Range Days
_S&R; Levels and 5, 15, and 30 Minute 20EMAs._____Expect range expansion when HisVol is low.
___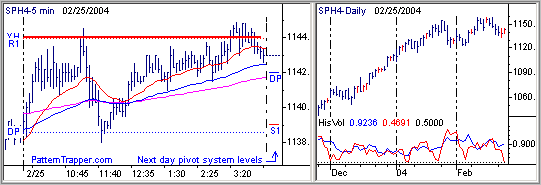 ___ ___
Pivot System S&R; Levels
Used to determine relative value.
Signficant shifts in market psychol-
ogy often occur near these levels.
R3_1151.80
R2_1148.87
R1_1145.93
DP_1141.97
S1_1139.03
S2_1135.07
S3_1132.13 | | Range Projections
This market will tend to trade within
the Normal High/Low Range levels
noted below. If they are exceeded,
use the Extended levels.
Extend High:_1149.09
Normal High:_1146.45
Normal Low: _1139.55
Extend Low: _1136.91 |
Pattern Signals Fired for Today's Trading in the March S&P; 500 (SPH4/ESH4)
A pattern recognition technique which identifies today's most likely scenario based on recent price activity.
Low Historical Volatility with an NR4 Signal
Historical Volatility is below trigger value and the day's range is the narrowest of the last 4 days.
Range expansion and a pickup in volatility is likely. Aggressive traders can trade the break of
the prior day 1144.90 high and 1138.00 low levels. Conservative traders should wait for the first
retracement after the initial breakout move.
Low Breakout Continuation Setup - Multi-daypattern setup indicates that if the prior day's
1138.00 low is taken out there is good likelihood of continuation for the rest of the day.
Momentum Pinball Sell Signal - A break of the first hour low is cause to become bearish. |
|
March Dow Jones (DJH4/YMH4)_Most Recent Trading Day With Pivot System ______Historical Volatility & Narrow Range Days
_S&R; Levels and 5, 15, and 30 Minute 20EMAs._____Expect range expansion when HisVol is low.
___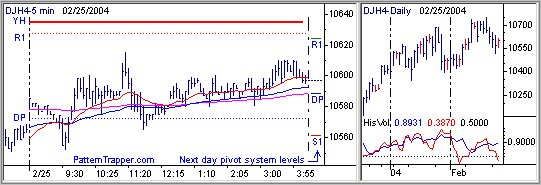 ___ ___
Pivot System S&R; Levels
Used to determine relative value.
Signficant shifts in market psychol-
ogy often occur near these levels.
R3_10678
R2_10651
R1_10624
DP_10588
S1_10561
S2_10525
S3_10498 | | Range Projections
This market will tend to trade within
the Normal High/Low Range levels
noted below. If they are exceeded,
use the Extended levels.
Extend High:_10653
Normal High:_10629
Normal Low: _10566
Extend Low: _10541 |
Pattern Signals Fired for Today's Trading in the March Dow Jones (DJH4/YMH4)
A pattern recognition technique which identifies today's most likely scenario based on recent price activity.
Low Historical Volatility with an NR4 Signal
Historical Volatility is below trigger value and the day's range is the narrowest of the last 4 days.
Range expansion and a pickup in volatility is likely. Aggressive traders can trade the break of
the prior day 10615 high and 10552 low levels. Conservative traders should wait for the first
retracement after the initial breakout move.
2 Day ROC Buy Signal - Short term swing patterns identify today as a buy day. |
|
March Nasdaq 100 (NDH4/NQH4)_Most Recent Trading Day With Pivot System ______Historical Volatility & Narrow Range Days
_S&R; Levels and 5, 15, and 30 Minute 20EMAs._____Expect range expansion when HisVol is low.
___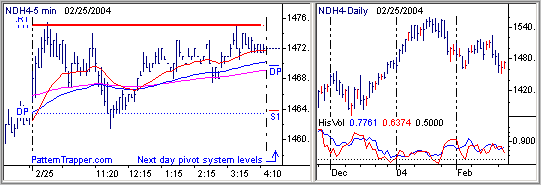 ___ ___
Pivot System S&R; Levels
Used to determine relative value.
Signficant shifts in market psychol-
ogy often occur near these levels.
R3_1489.50
R2_1483.67
R1_1477.83
DP_1469.67
S1_1463.83
S2_1455.67
S3_1449.83 | | Range Projections
This market will tend to trade within
the Normal High/Low Range levels
noted below. If they are exceeded,
use the Extended levels.
Extend High:_1484.35
Normal High:_1479.00
Normal Low: _1465.00
Extend Low: _1459.65 |
Pattern Signals Fired for Today's Trading in the March Nasdaq 100 (NDH4/NQH4)
A pattern recognition technique which identifies today's most likely scenario based on recent price activity.
NR7 Signal - Today's trading range is the narrowest of the seven days.
Range expansion and a pickup in volatility is likely. Aggressive traders can trade the break of
the prior day 1475.50 high and 1461.50 low levels. Conservative traders should wait for the first
retracement after the initial breakout move.
Low Breakout Continuation Setup - Multi-daypattern setup indicates that if the prior day's
1461.50 low is taken out there is good likelihood of continuation for the rest of the day. |
|
March US T-Bond (USH4/ZBH4)_Most Recent Trading Day With Pivot System ______Historical Volatility & Narrow Range Days
_S&R; Levels and 5, 15, and 30 Minute 20EMAs._____Expect range expansion when HisVol is low.
___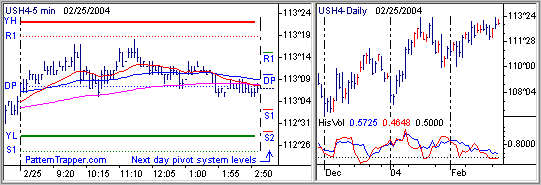 ___ ___
Pivot System S&R; Levels
Used to determine relative value.
Signficant shifts in market psychol-
ogy often occur near these levels.
R3_113-31
R2_113-23
R1_113-15
DP_113-10
S1_113-02
S2_112-29
S3_112-21 | | Range Projections
This market will tend to trade within
the Normal High/Low Range levels
noted below. If they are exceeded,
use the Extended levels.
Extend High:_113-18
Normal High:_113-14
Normal Low: _113-01
Extend Low: _112-28 |
Pattern Signals Fired for Today's Trading in the March US T-Bond (USH4/ZBH4)
A pattern recognition technique which identifies today's most likely scenario based on recent price activity.
Low Historical Volatility with an NR7 Signal
Historical Volatility is below trigger value and the day's range is the narrowest of the last 7 days.
Range expansion and a pickup in volatility is likely. Aggressive traders can trade the break of
the prior day 113-18 high and 113-05 low levels. Conservative traders should wait for the first
retracement after the initial breakout move.
2 Day ROC Sell Signal - Short term swing patterns identify today as a sell day.
Low Range Close Signal - 80-85% chance that today's low will be less than yesterday's. |
|
Statement of disclaimer: This information was compiled from sources believed to be reliable, but its
accuracy cannot be guaranteed. There is substantial risk of loss in stock and futures trading. There
is no warranty, express or implied, in regards to the fitness of this information for any particular
purpose. Past performance is not a guarantee of future results.
All materials are copyright © 2004 by Bob Hunt. No part of these resources may be reproduced,
stored or transmitted without the prior written permission of the copyright holder. |
____ Subscribe________ Trading Course________ Indicator Packages________ Home
|