THE PATTERN TRAPPER
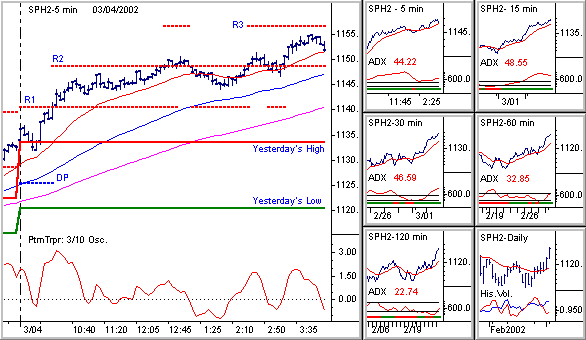
Suggested Intraday Charting Workspace


 Home           Indicator Packages         Subscribe         Trading Course         Free Trial 
This layout depicts the basic intraday charting workspace used by The Pattern Trapper.
Pause your mouse cursor over any item to read a short description (works with Internet Explorer only).

We also monitor Historical Volatility levels
in the daily timeframe to tell us when the
market is primed for a strong move. We monitor Exponential Moving Averages and ADX
levels in 5 different intraday time frames. This helps us
track overall market "trendiness" and allows us to decide
when and if the market is likely to return to trend. The 3/10 Oscillator is used to measure and
compare price momentum behind successive
market swings. This allows us to decide
whether the current swing direction is likely
to continue or to reverse. 5 minute OHLC bars are the base chart pattern
advocated by The Pattern Trapper. OHLC bars offer
quick and easy identification of critical Reversal
Patterns. Candlestick bars can be used if preferred. The "dynamic" characteristics of the 20 EMA (it's
ability to react in accordance to more immediate
changes in the market environment) make it an
important support and resistance tool. The "dynamic" characteristics of the 20 EMA (it's
ability to react in accordance to more immediate
changes in the market environment) make it an
important support and resistance tool. The "dynamic" characteristics of the 20 EMA (it's
ability to react in accordance to more immediate
changes in the market environment) make it an
important support and resistance tool. 5 minute OHLC bars are the base chart pattern
advocated by The Pattern Trapper. OHLC bars offer
quick and easy identification of critical Reversal
Patterns. Candlestick bars can be used if preferred. 5 minute OHLC bars are the base chart pattern
advocated by The Pattern Trapper. OHLC bars offer
quick and easy identification of critical Reversal
Patterns. Candlestick bars can be used if preferred. Resistance Level 3 - Pivot System Support & Resistance
levels are used to determine relative value based on prior
day price action. Significant shifts in market psychology
often occur near these levels. Resistance Level 2 - Pivot System Support & Resistance
levels are used to determine relative value based on prior
day price action. Significant shifts in market psychology
often occur near these levels. Resistance Level 1 - Pivot System Support & Resistance
levels are used to determine relative value based on prior
day price action. Significant shifts in market psychology
often occur near these levels. Daily Pivot Level  -  Pivot System Support & Resistance
levels are used to determine relative value based on prior
day price action. Significant shifts in market psychology
often occur near these levels. Yesterday's High - Prior day highs and lows represent
extreme points of apparent value, and can act as support
and resistance levels throughout the day. Price action near
these levels offer clues about the market's underlying bias. Yesterday's Low - Prior day highs and lows represent
extreme points of apparent value, and can act as support
and resistance levels throughout the day. Price action near
these levels offer clues about the market's underlying bias.

 Home           Indicator Packages         Subscribe         Trading Course         Free Trial