|
|
 ADVANCED Short Term Trading Strategies ADVANCED Short Term Trading Strategies
Individual Indicators
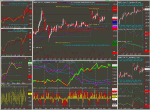
A number of truly unique and highly advanced technical indicators that had been originally developed exclusively for participants in the Pattern Trapper Advanced Short Term Trading mentoring program are now being made available for individual purchase. Each indicator comes with installation instructions, guidelines for suggested use, and a sample workspace that can be used to copy indicator chart setups and paste into existing or new workspace environments.
The indicators listed for individual sale below do not represent the total number offered through the Pattern Trapper Advanced Short Term Trading mentoring program. Traders must participate in the mentoring program in order to acquire the complete set. For those interested in using all of the indicators and strategies available through this program, it would be far more cost-effective to participate in one of the mentoring programs described above.
Although all of these indicators were originally designed to be used in trading the Mini Index Futures contracts, several of them can be used quite effectively in trading any active, liquid market exhibiting good trending characteristics (i.e., Forex).
Please feel free to call Bob Hunt with any questions about these indicators- 952-892-5550
Any Market
JumpStart Oscillator & Alerts - $325
Click on the button for secure payment via credit card or PayPal account. | |
|
As the flagship indicator for the new JumpStart Mentoring Program, the JumpStart Buy/Sell indicator is specifically designed for the new and/or consistently losing trader. It not only identifies the potential for high probability trade setups, but even dictates entry level and subsequent trade management. The indicator calculates four separate measurements of trend and trend momentum and requires that at least three out of the four are indicating a common directional move before a signal is triggered. Once identified a colored dot is plotted on the trigger bar, an audio alert is activated, and the signal bar itself determines the specific level where the stop entry order is to be placed. The pre-formatted trade entry Matrix manages the rest of the trade. Once flat, the indicator even knows when to fire a re-entry signal should the market resume its former trend.
CandleTrader - $325
Click on the button for secure payment via credit card or PayPal account. | |
|
The CandleTrader indicator automatically identifies 8 sets of candlestick patterns: Doji, Hammer/Hanging Man, Bullish/Bearish Harami, Bullish/Bearish Engulfing, Dark Cloud Cover/Piercing Line, Morning/Evening Star, NR7/NR7 Inside Bar, and the Wide Range 7. Trade entry levels based on the most recent identified pattern are displayed to the right of the trigger bar. Those patterns that have a bullish implication will display an entry level 1 tick above the high of the trigger bar. Those that are bearish will display an entry level 1 tick below the low of the trigger bar. Those that indicate range contraction or expansion will display both buy and sell levels. Each candle pattern set has an input parameter of either True or False, allowing the user to determine which set they'd like to have identified. When using this indicator the intent is NOT to trade every identified candlestick pattern, but to utilize only those that agree with our overall assessment of market potential (buy setups if the market has already demonstrated a long bias or has bounced against a price area that we consider to have the potential to be strong support, and short setups if the market has already demonstrated a short bias or has bounced against a price area that we consider to have the potential to be strong resistance).
First Hour Bias - $175
Click on the button for secure payment via credit card or PayPal account. | |
|
The First Hour Bias indicator measures bar-to-bar price relationships during the first hour of the trading day to make a determination of the most likely directional move for the rest of the day. Once the first hour is complete, one of five text messages will be displayed, listed in order of strength from most bullish to most bearish - "1ST HOUR STRONG UP BIAS", "1ST HOUR UP BIAS", "1ST HOUR NEUTRAL", "1ST HOUR DOWN BIAS", "1ST HOUR STRONG DOWN BIAS". Each of these is accompanied by a corresponding audio alert and a large colored dot placed on the first hour bar. If a directional bias is indicated it does NOT mean that we want to place our intraday trades only in that direction. It, instead, implies varying degrees of potential difference between the day's open and the day's close (with roughly a 70% accuracy rate). In practical terms, it means that we want to focus the bulk of our efforts on trades in the direction indicated by the First Hour Bias.
Key Reversal Buy/Sell - $250
Click on the button for secure payment via credit card or PayPal account. | |
|
The Key Reversal is a fairly common two-bar pattern that often marks short term intraday turning points. In a trending market, Key Reversal identification can be used as an entry trigger during a pullback in the primary trend. Under choppy conditions the aggressive trader can use it to scalp the characteristic back-and-forth activity inherent in that market climate. The indicator not only identifies the potential for a high probability Key Reversal trade setup, but even dictates entry level and subsequent trade management. Once identified a colored cross is plotted either above the trigger bar in the case of a Key Reversal to the downside, or below the trigger bar in the case of a Key Reversal to the upside. At the same time, an audio alert is activated and a text display identifies the specific level where the stop entry order is to be placed. The pre-formatted trade entry Matrix manages the rest of the trade.
Vol-X - $275
Click on the button for secure payment via credit card or PayPal account. | |
|
The Volatility Expansion Meter (Vol-X for short) measures the market's current state of expansion/contraction and signals when a big move is about to begin. A gray display indicates that we are in a "non-alert" mode (the market in this timeframe has not yet moved into a state of contraction). A yellow display indicates "alert" mode (the market in this timeframe has moved into a state of contraction and we should be on standby for an expansion signal). A red display signals the beginning of an expansion move to the downside. A green display signals the beginning of an expansion move to the upside. Audio alerts let the user know when a signal has fired without having to keep a close eye on the display. Although the Vol-X indicator can be applied to any chart, it works especially well in the tighter timeframes to trigger trade entry in the correct direction after an extended period of contraction.
Bias Bars - $275
Click on the button for secure payment via credit card or PayPal account. | |
|
Easily identifies the directional bias for any timeframe. A series of green bars implies an upmove while a series of red bars suggests further downside. Usually applied to a vertical arrangement of charts with progressively longer timeframes from top to bottom. This affords the trader a quick assessment of the total number of timeframes with similar bias and the predominant bias direction. Multiple timeframes implying the same direction imply more confident trade entry. The rule-of-thumb is to avoid entry until at least two timeframes agree with the intended trade direction. Combining the Bias Bar indicator with the Vol-X indicator results in a very powerful trade entry mechanism.
Modified ADX - $275
Click on the button for secure payment via credit card or PayPal account. | |
|
Traditional use of ADX interprets a market to be trending when levels are high (i.e., 30 or above). The Modified ADX indicator uses a proprietary algorithm to signal a market moving into a trend much earlier than traditional use normally does. ADX Histogram will be DarkGrey when no trend exists - Red during a downtrend - and Green during an uptrend. A red or green histogram suggests that we start looking for trades in the appropriate direction. For the index markets the indicator is normally applied to 1, 2, and 5 minute charts. The more timeframes that are trending, the more confident our entries. The indicator is defaulted to elicit a voice alert describing both the timeframe and direction fired whenever an ADX signal is triggered. Note: 40 or 50 tick Vol-X firings are an excellent entry mechanism once we have a trend defined by the Modified ADX. It allows us to participate in the early stages of a strong trend move while avoiding the chop period that normally precedes them.
Index Markets Only - S&P;, Dow Jones, Nasdaq, Russell (both pit and minis)
TickSmart - $275
Click on the button for secure payment via credit card or PayPal account. | |
|
The NYSE Tick represents a running account of the number of stocks trading higher on the NYSE minus the number of stocks trading lower. This is one of the most powerful tools available for trading index futures contracts. The Pattern Trapper TickSmart indicator is crafted for quick and easy understanding and interpretation of this critical market measurement. It does this by providing (1) separate line plots for both the closing and extreme values of each time interval, which allow the trader to focus on the most important aspects of Tick development while eliminating nonessential information, (2) Extreme Tick level reference lines and associated voice alerts whenever Tick values reach critical magnitudes, (3) both audio alert and on-screen display of Overbought/Oversold Tick conditions which offer high probability short term turning points, and (4) a running account and display of both daily high and daily low Tick values as an additional aid in identifying potential support and resistance levels. As an added bonus, purchase of this indicator includes a PDF file describing of each of the 7 different methods of using NYSE Tick as an aid in understanding and interpreting underlying market forces.
Gap Play - $325
Click on the button for secure payment via credit card or PayPal account. | |
|
This indicator is designed to take full advantage of just one of the three highest probability trade setups that typically occur during the opening few hours of the day. For those who can devote only a limited amount of time to trading, this indicator is a must! For more details and an eight minute video on the Pattern Trapper Open Gap Trading Technique Click Here! During the hours before and as the market nears its opening bell, the indicator constantly updates the difference between the prior day close and the current price. Using gap level historical price information, market-specific probability of closure is calculated and displayed as a known value just prior to the beginning of each trading day. This information is dependant on the direction and size of the gap, and can tell us what the chances for full closure happen to be along with the odds of half-gap closure (which are always greater than full closure). It also determines the probability of closure based on the current day of the week, as well as note any other day-specific variables that may effect the probability of gap closure (such as special precautions necessary during the monthly options expiration period and Employment Report days). The indicator also makes note of special situation days (such as FOMC announcements and Triple or Quadruple Witching) and describes specific trading strategies that take advantage of reliable time/price relationships that normally occur on these days. As an added bonus the indicator even alerts the trader with a "heads up" on the day before contract rollover, with follow-up specific instructions the next morning! Never trade the wrong month again.
Gap Play Paramater Levels - $125
Click on the button for secure payment via credit card or PayPal account. | |
|
This indicator is used in conjunction with the Gap Play indicator and serves as a powerful aid in visualizing Gap Play parameters. It is normally plotted on a 1, 2, or 5 minute candlestick chart and displays reference lines representing the Full Gap Closure Level, Half Gap Closure Level, and Current Day Open Level. These reference lines not only help to identify profit target levels, but also flag potential reversal points. Input parameters for this indicator include line duration, color, and labeling (left side, right side, both, or off). As an added bonus, the indicator will also plot the high and low range levels for the first 15 minutes of trading, which often act as significant support and resistance levels.
Time Alert Lines & Text - $275
Click on the button for secure payment via credit card or PayPal account. | |
|
During certain key time periods throughout the trading day the index markets have a tendency to develop in a particular manner. This indicator displays vertical dashed lines and accompanying text that notify and describe general expectations during these key time periods. The text also display specific high probability strategies when certain key price/time parameters are in place. For example, the nature of price action within the first 30 minutes of the day is often a good predictor as to whether the day is more likely to develop in a choppy or trending manner. The indicator alerts you when these types of price/time parameters exist, and displays a suggested trading strategy.
Pivot System Levels - $275
Click on the button for secure payment via credit card or PayPal account. | |
|
This indicator is used to plot seven levels of potential support and resistance on an intraday chart. Significant shifts in market psychology often occur near these values. The trader can use specific price action near these levels as either an entry or profit-taking trigger. Input parameters for this indicator allow the user to have appropriate labeling notations placed either to the left of the plotted line, to the right, both left and right, or to have labeling turned off completely. It also offers independent line color selection for all support lines, all resistance lines, and the Daily Pivot.
Prior Day Parameters - $175
Click on the button for secure payment via credit card or PayPal account. | |
|
This indicator helps to identify some of the strongest support and resistance levels that one typically finds during the course of a trading day - that of the prior day high and low. As an added bonus, the indicator also identifies the high and low from two days prior, which often turn out to be just as significant as the high and low of the prior day (sometimes even more so). Input parameters for this indicator allow the user to have appropriate labeling notations placed either to the left of the plotted line, to the right, both left and right, or to have labeling turned off completely. It also offers independent line color selection for high and low levels. As an added bonus, the indicator even includes the option for plotting the current day open and the prior day close.
Pattern Trapper Bands - $175
Click on the button for secure payment via credit card or PayPal account. | |
|
Pattern Trapper Bands use a proprietary algorithm to provide a short term assessment of high and low data values. During a congestion (contraction) market phase the top and bottom bands provide excellent reference points for selling towards the top band and buying towards the bottom. During a trending market the midline provides a good support reference level (in an uptrend) or a good resistance level (in a downtrend). They are typically used on both the price chart and the NYSE Tick chart and can be applied to any timeframe.
| Volume DISCOUNT! - the following discounts are available on multiple indicator purchases. | |
Number of
Indicators Purchased |
|
% Discount Off the
Total of the Listed Prices | |
|
3-5 | |
| 10% |
| 6-8 | | | 15% |
| 9-11 | | | 20% |
| 12+ | | | 25% | | For volume discount payment instructions call 952-892-5550 or email RHunt@PatternTrapper.com
with a list of the indicators desired. |
 
Bob Hunt - editor of the Pattern Trapper Futures Trading Newsletter and
creator of the Pattern Trapper Advanced Short Term Trading Strategies program.
"The personal aspect that I enjoy most about working with other traders is that it forces me to develop a deeper understanding of why I trade the way that I do. Before I can explain the process to anyone else I have to have a very clear under-standing of it in my own mind. Working with other traders forces me to confront my own beliefs about trading, and in the process, makes me a better trader.
If you're a current or prospective Tradestation user, and have questions, please feel free to contact me at 952·892·5550. Because the mentoring program involves extensive one-on-one training, the service is limited to only two participants at a time. The sooner you sign up, the sooner we can schedule your sessions. And more importantly, the sooner you'll notice a difference in your trading."
Get Tradestation FREE for 30 days! Click Here!
To read about the program's Gap Trade technique Click Here!
| Disclaimer: There is substantial risk of loss in futures trading, as well as large potential rewards. There is no war-ranty in regards to the fitness of this information for any particular purpose. Past performance is not a guarantee of future results. Neither TradeStation Technologies nor any of its affiliates has reviewed, certified, endorsed, approved, disapproved or recommended, and neither does or will review, certify, endorse, approve, disapprove or recommend any trading software tool that is designed to be compatible with the TradeStation Open Platform |
|
|