| 

Technical Tools For The Active Trader:
Techniques for Capturing Intraday Profits.
By Bob Hunt
1
2
3
4
5
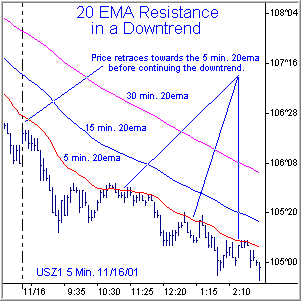
Once the market has made a convincing breach of a particular support or resistance level, that level is considered to have reversed its support/resistance role, and, subsequently, becomes a test point for further market activity. For example, in the chart to the right, when price action develops into an upside break of the first level of resistance (R1), the retracement move back towards that level is considered a test of its integrity. A successful test occurs when the retracement move is turned away and price moves even further to the upside - which adds even greater credibility to that level as a renewed valuation point. Additionally, any further move away from that level has the potential to force the market through successive levels of support or resistance, drawing players of even longer time-frame perspectives into the market . . . and so on, continually expanding the market's range of activity.
When properly used, Pivot System Support and Resistance Levels can become a very helpful tool for the Active trader. The approach is not only a quick way of gauging intraday valuation levels, but also offers an effective means of applying interpretative "templates" to market activity so as to better understand market behavior and spot opportunity. They help to determine when and where short-term intraday trends are likely to hesitate, and can also serve as "test points" in deciding whether the market may be more likely to either continue or reverse its current direction.
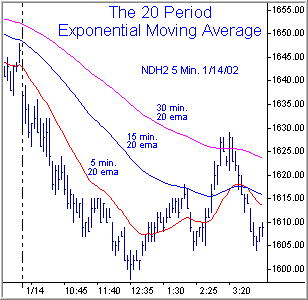
Dynamic Support & Resistance Levels for Intraday Trading
As helpful as Pivot System levels often are, a significant drawback to their use lies in the fact that they are calculated from the prior day's price action, and may not accurately reflect recent changes in market psychology. Effective intraday trading also requires a means of identifying support and resistance which can more easily adapt and more accurately represent price activity under rapidly changing market conditions. The 20 period Exponential Moving Average (20EMA) can be used to create these more "dynamic" levels of support and resistance. Unlike Pivot System S&R; levels that remain constant throughout the day, the 20EMA changes in accordance with more immediate changes in price. This feature makes them a very effective tool, especially when significant shifts in market psychology occur between Pivot System levels, and after large thrusting impulse moves.
My principle intraday chart reference is the five minute timeframe with frequent note of other periods as market conditions warrant. For this reason, the 5 min. 20EMA is our most often referenced moving average. However, it is also helpful to additionally graph both the 15 min. and 30 min. 20EMAs on the same 5 minute chart. This is accomplished by plotting the following values.
5 min. 20EMA - plot a 20 period Exponential Moving Average.
15 min. 20EMA - plot a 60 period Exponential Moving Average (15/5*20)
30 min. 20EMA - plot a 120 period Exponential Moving Average (30/5*20)
It is important to recognize that the 15 and 30 minute values arrived at with this method are not exact and precise representation of the corresponding 15 and 30 minute 20EMAs, but for purposes of identifying potential support and resistance levels, you will find the technique quite useful.
The 20 period EMA is treated as we would any other potential support or resistance level. In congested, trading range market conditions, these levels can be violated rather easily. However, when price begins to trend, the 20EMA can be a valuable aid in determining appropriate areas in which to take action either by establishing new positions . . . or baling out of existing ones.
Charts created by Tradestation. |
1
2
3
4
5
|
|
|
